
Diabetes is a chronic metabolic disorder characterized by high blood glucose levels. Accurate diagnosis is crucial for timely intervention and effective management of the condition. This article aims to provide an in-depth understanding of blood glucose levels for diagnosing diabetes, along with the significance of adopting a diet focused on low glycemic foods for individuals with diabetes or prediabetes.
Blood Glucose Levels and Diabetes Diagnosis
 The measurement of blood glucose levels is central to the diagnosis of diabetes. The two primary tests used are fasting plasma glucose (FPG) and oral glucose tolerance test (OGTT). Let’s explore these diagnostic methods in detail:
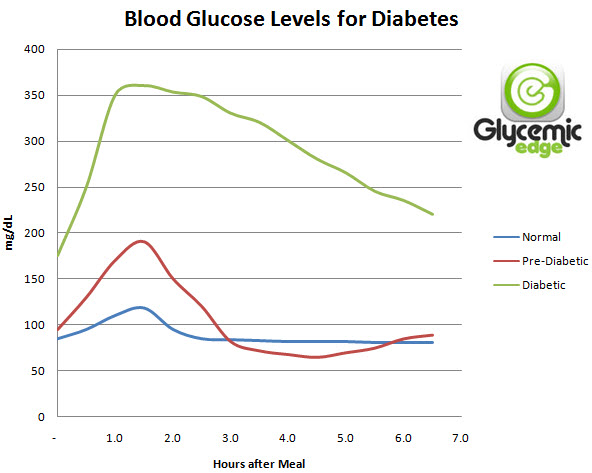
- Fasting Plasma Glucose (FPG) Test: The FPG test involves measuring blood glucose levels after an overnight fast of at least 8 hours. A blood glucose level of 126 milligrams per deciliter (mg/dL) or higher on two separate occasions is indicative of diabetes.
- Oral Glucose Tolerance Test (OGTT): The OGTT is performed by measuring blood glucose levels before and two hours after consuming a glucose-rich drink. A blood glucose level of 200 mg/dL or higher after two hours confirms diabetes.
It’s important to note that diabetes diagnosis should be made based on clinical judgment, taking into account symptoms, risk factors, and other relevant factors.
Glucose Plasma Levels and Diagnosis Chart
Here is a chart showcasing blood glucose levels and their corresponding diagnostic categories:
| Diagnostic Category | Fasting Plasma Glucose (mg/dL) | 2-hour OGTT (mg/dL) |
|---|---|---|
| Normal | Less than 100 | Less than 140 |
| Prediabetes (Impaired | 100-125 | 140-199 |
| Fasting Glucose or | ||
| Impaired Glucose | ||
| Tolerance) | ||
| Diabetes | 126 or higher | 200 or higher |
Adopting a Low-Glycemic Diet for Diabetes Management
For individuals diagnosed with diabetes or prediabetes, a low-glycemic diet can be a valuable tool for managing blood glucose levels effectively. This dietary approach focuses on consuming foods that have a minimal impact on blood sugar levels. Here’s how it can help:
- Stable Blood Glucose Levels: Low-glycemic foods release glucose into the bloodstream more slowly, preventing sharp spikes and crashes in blood sugar levels. This stability is particularly beneficial for individuals with diabetes, as it helps to maintain their blood glucose within a healthy range.
- Improved Insulin Sensitivity: Following a low-glycemic diet can enhance insulin sensitivity, allowing the body to utilize insulin more effectively. This can help individuals with diabetes to better regulate their blood glucose levels and reduce the need for medication or insulin injections.
- Enhanced Satiety and Weight Management: Low-glycemic foods, such as whole grains, legumes, fruits, and vegetables, are typically high in fiber and provide a sense of fullness. This can aid in weight management by reducing hunger pangs and controlling portion sizes, as excess weight is a risk factor for developing diabetes or worsening its symptoms.
- Cardiovascular Health Benefits: Diabetes increases the risk of cardiovascular diseases. A low-glycemic diet, rich in heart-healthy fats, lean proteins, and complex carbohydrates, can help manage blood pressure, cholesterol levels, and overall cardiovascular health.
- Improved Overall Diet Quality: Emphasizing low-glycemic foods encourages a balanced and varied diet, promoting the intake of essential nutrients and reducing the consumption of processed and sugary foods. This dietary approach can contribute to overall health and well-being.
Blood Sugar and low Glycemic Index Rated Foods
 Accurate diagnosis of diabetes is crucial for effective management. Blood glucose levels, measured through tests like FPG and OGTT, help in diagnosing diabetes and prediabetes. Furthermore, adopting a low-glycemic diet can be a beneficial approach for individuals with diabetes or prediabetes. By promoting stable blood glucose levels, improved insulin sensitivity, weight management, and cardiovascular health, a low-glycemic diet can play a vital role in the overall management of diabetes. Consultation with healthcare professionals and registered dietitians is recommended to tailor the diet to individual needs and ensure optimal diabetes care.
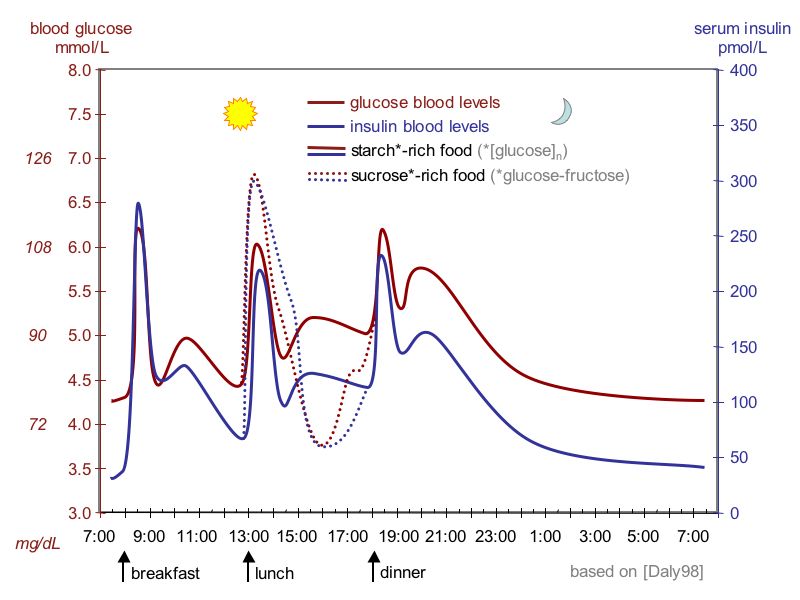
I notice that after each glucose spike there’s a drop and then another smaller spike. What causes the second rise?